Plot the data and the change points for a fastcpd object
Usage
# S3 method for class 'fastcpd'
plot(
  x,
  color_max_count = Inf,
  data_point_alpha = 0.8,
  data_point_linewidth = 0.5,
  data_point_size = 1,
  legend_position = "none",
  panel_background = ggplot2::element_blank(),
  panel_border = ggplot2::element_rect(fill = NA, colour = "grey20"),
  panel_grid_major = ggplot2::element_line(colour = "grey98"),
  panel_grid_minor = ggplot2::element_line(colour = "grey98"),
  segment_separator_alpha = 0.8,
  segment_separator_color = "grey",
  segment_separator_linetype = "dashed",
  strip_background = ggplot2::element_rect(fill = "grey85", colour = "grey20"),
  xlab = NULL,
  ylab = NULL,
  ...
)

# S4 method for class 'fastcpd,missing'
plot(
  x,
  color_max_count = Inf,
  data_point_alpha = 0.8,
  data_point_linewidth = 0.5,
  data_point_size = 1,
  legend_position = "none",
  panel_background = ggplot2::element_blank(),
  panel_border = ggplot2::element_rect(fill = NA, colour = "grey20"),
  panel_grid_major = ggplot2::element_line(colour = "grey98"),
  panel_grid_minor = ggplot2::element_line(colour = "grey98"),
  segment_separator_alpha = 0.8,
  segment_separator_color = "grey",
  segment_separator_linetype = "dashed",
  strip_background = ggplot2::element_rect(fill = "grey85", colour = "grey20"),
  xlab = NULL,
  ylab = NULL,
  ...
)
Arguments
- x
A fastcpd object.
- color_max_count
Maximum number of colors to use for the plotting of segments.
- data_point_alpha
Alpha of the data points.
- data_point_linewidth
Linewidth of the data points.
- data_point_size
Size of the data points.
- legend_position
Position of the legend.
- panel_background
Background of the panel.
- panel_border
Border of the panel.
- panel_grid_major
Major grid lines of the panel.
- panel_grid_minor
Minor grid lines of the panel.
- segment_separator_alpha
Alpha of the segment separator lines.
- segment_separator_color
Color of the segment separator lines.
- segment_separator_linetype
Linetype of the segment separator lines.
- strip_background
Background of the strip.
- xlab
Label for the x-axis.
- ylab
Label for the y-axis.
- ...
Ignored.
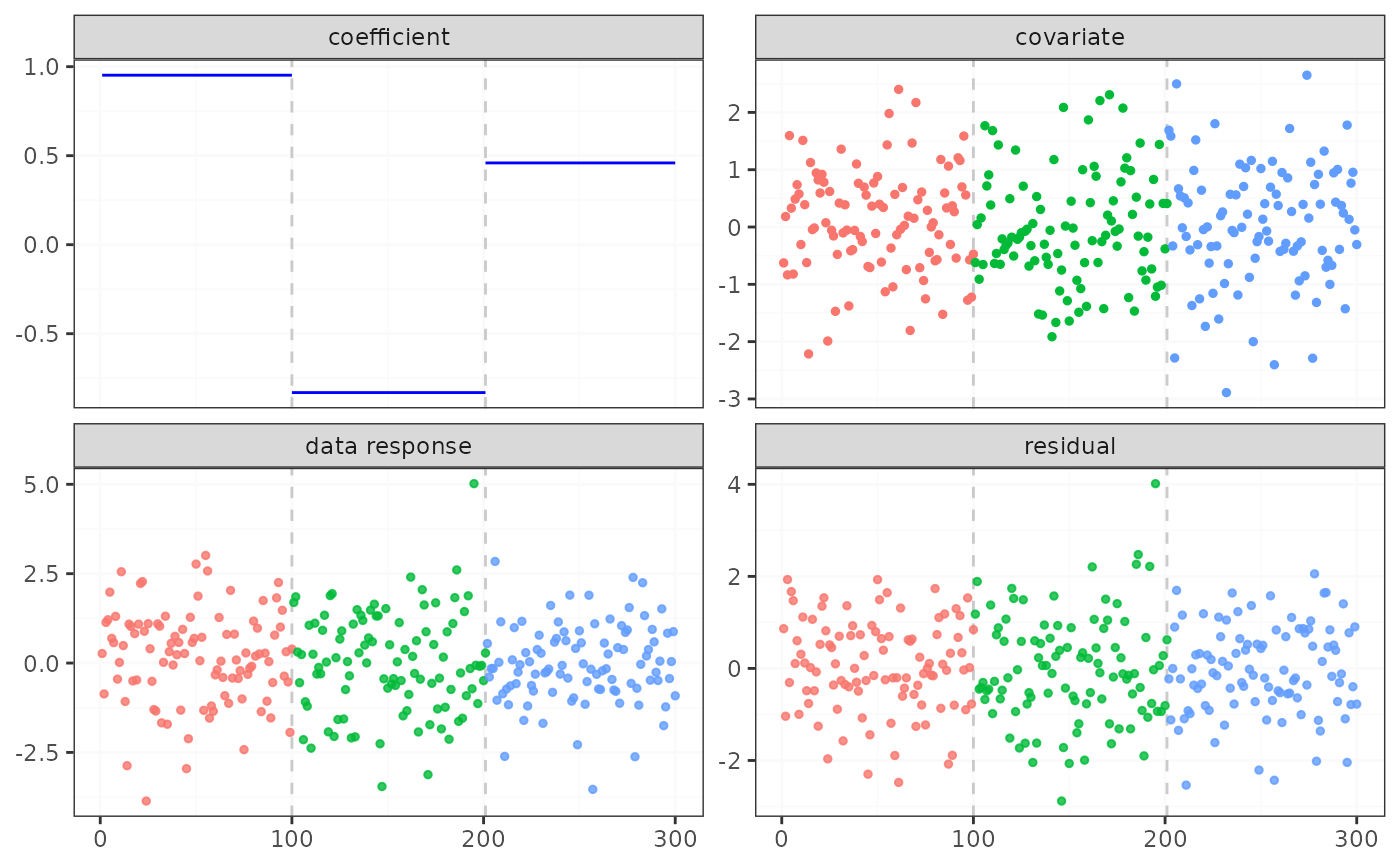
Examples
if (requireNamespace("mvtnorm", quietly = TRUE)) {
  set.seed(1)
  p <- 1
  x <- mvtnorm::rmvnorm(300, rep(0, p), diag(p))
  theta_0 <- matrix(c(1, -1, 0.5))
  y <- c(
    x[1:100, ] * theta_0[1, ] + rnorm(100, 0, 1),
    x[101:200, ] * theta_0[2, ] + rnorm(100, 0, 1),
    x[201:300, ] * theta_0[3, ] + rnorm(100, 0, 1)
  )
  result <- fastcpd.lm(cbind(y, x))
  summary(result)
  plot(result)
}
#>
#> Call:
#> fastcpd.lm(data = cbind(y, x))
#>
#> Change points:
#> 100 201
#>
#> Cost values:
#> 51.02185 69.03349 48.51457
#>
#> Parameters:
#>   segment 1  segment 2 segment 3
#> 1 0.9520606 -0.8307605 0.4593161