![]()
![]()
![]()


Overview
The fastcpd (fast change point detection) is a fast implmentation of change point detection methods in R/Python.
Documentation
- R documentation: fastcpd.xingchi.li
- Python documentation: fastcpd.xingchi.li/python
Installation
R
# install.packages("devtools")
devtools::install_github("doccstat/fastcpd")
# or install from CRAN
install.packages("fastcpd")Usage
R
set.seed(1)
n <- 1000
x <- rep(0, n + 3)
for (i in 1:600) {
  x[i + 3] <- 0.6 * x[i + 2] - 0.2 * x[i + 1] + 0.1 * x[i] + rnorm(1, 0, 3)
}
for (i in 601:1000) {
  x[i + 3] <- 0.3 * x[i + 2] + 0.4 * x[i + 1] + 0.2 * x[i] + rnorm(1, 0, 3)
}
result <- fastcpd::fastcpd.ar(x[3 + seq_len(n)], 3, r.progress = FALSE)
summary(result)
#>
#> Call:
#> fastcpd::fastcpd.ar(data = x[3 + seq_len(n)], order = 3, r.progress = FALSE)
#>
#> Change points:
#> 614
#>
#> Cost values:
#> 2754.116 2038.945
#>
#> Parameters:
#>     segment 1 segment 2
#> 1  0.57120256 0.2371809
#> 2 -0.20985108 0.4031244
#> 3  0.08221978 0.2290323
plot(result)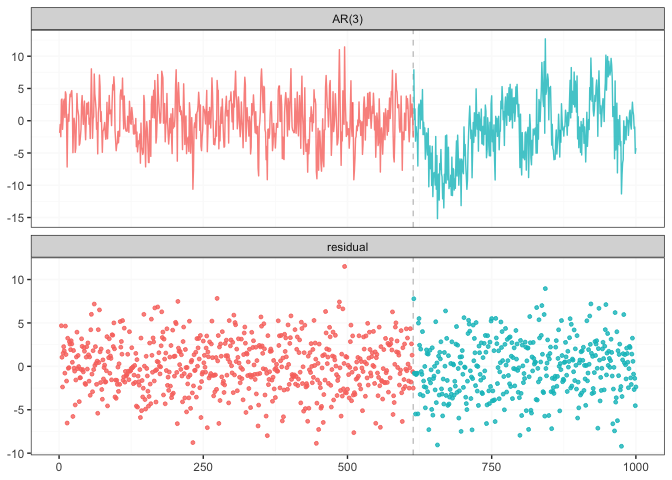
Python WIP
import fastcpd.segmentation
from numpy import concatenate
from numpy.random import normal, multivariate_normal
covariance_mat = [[100, 0, 0], [0, 100, 0], [0, 0, 100]]
data = concatenate((multivariate_normal([0, 0, 0], covariance_mat, 300),
                    multivariate_normal([50, 50, 50], covariance_mat, 400),
                    multivariate_normal([2, 2, 2], covariance_mat, 300)))
fastcpd.segmentation.mean(data)

import fastcpd.variance_estimation
fastcpd.variance_estimation.mean(data)
Comparison
library(microbenchmark)
set.seed(1)
n <- 5 * 10^6
mean_data <- c(rnorm(n / 2, 0, 1), rnorm(n / 2, 50, 1))
ggplot2::autoplot(microbenchmark(
  wbs = wbs::wbs(mean_data),
  not = not::not(mean_data, contrast = "pcwsConstMean"),
  changepoint = changepoint::cpt.mean(mean_data, method = "PELT"),
  jointseg = jointseg::jointSeg(mean_data, K = 12),
  fpop = fpop::Fpop(mean_data, 2 * log(n)),
  mosum = mosum::mosum(c(mean_data), G = 40),
  fastcpd = fastcpd::fastcpd.mean(mean_data, r.progress = FALSE, cp_only = TRUE, variance_estimation = 1)
))
#> Warning in microbenchmark(wbs = wbs::wbs(mean_data), not = not::not(mean_data,
#> : less accurate nanosecond times to avoid potential integer overflows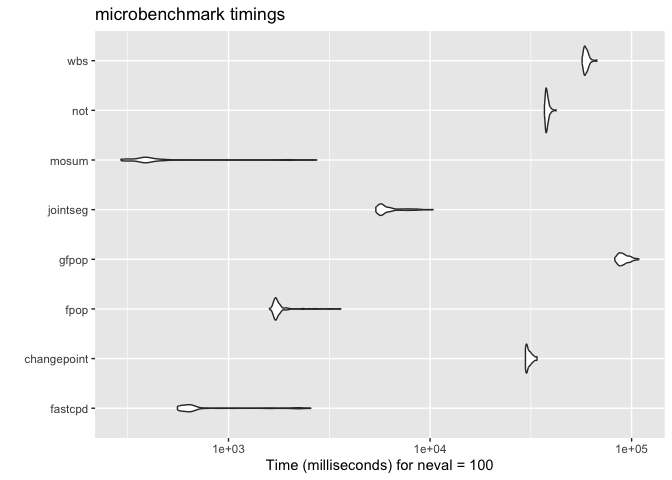
library(microbenchmark)
set.seed(1)
n <- 10^8
mean_data <- c(rnorm(n / 2, 0, 1), rnorm(n / 2, 50, 1))
system.time(fastcpd::fastcpd.mean(mean_data, r.progress = FALSE, cp_only = TRUE, variance_estimation = 1))
#>    user  system elapsed
#>  11.753   9.150  26.455
system.time(mosum::mosum(c(mean_data), G = 40))
#>    user  system elapsed
#>   5.518  11.516  38.368
system.time(fpop::Fpop(mean_data, 2 * log(n)))
#>    user  system elapsed
#>  35.926   5.231  58.269
system.time(changepoint::cpt.mean(mean_data, method = "PELT"))
#>    user  system elapsed
#>  32.342   9.681  66.056
ggplot2::autoplot(microbenchmark(
  changepoint = changepoint::cpt.mean(mean_data, method = "PELT"),
  fpop = fpop::Fpop(mean_data, 2 * log(n)),
  mosum = mosum::mosum(c(mean_data), G = 40),
  fastcpd = fastcpd::fastcpd.mean(mean_data, r.progress = FALSE, cp_only = TRUE, variance_estimation = 1),
  times = 10
))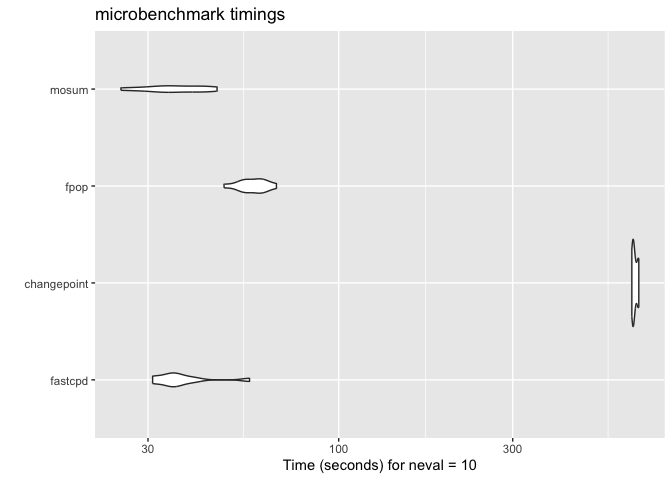
Some packages are not included in the microbenchmark comparison due to either memory constraints or long running time.
# Device: Mac mini (M1, 2020)
# Memory: 8 GB
system.time(CptNonPar::np.mojo(mean_data, G = floor(length(mean_data) / 6)))
#> Error: vector memory limit of 16.0 Gb reached, see mem.maxVSize()
#> Timing stopped at: 0.061 0.026 0.092
system.time(ecp::e.divisive(matrix(mean_data)))
#> Error: vector memory limit of 16.0 Gb reached, see mem.maxVSize()
#> Timing stopped at: 0.076 0.044 0.241
system.time(strucchange::breakpoints(y ~ 1, data = data.frame(y = mean_data)))
#> Timing stopped at: 265.1 145.8 832.5
system.time(breakfast::breakfast(mean_data))
#> Timing stopped at: 45.9 89.21 562.3
FAQ
Should I install suggested packages?
The suggested packages are not required for the main functionality of the package. They are only required for the vignettes. If you want to learn more about the package comparison and other vignettes, you could either check out vignettes on CRAN or pkgdown generated documentation.
I countered problems related to gfortran on Mac OSX or Linux!
The package should be able to install on Mac and any Linux distribution without any problems if all the dependencies are installed. However, if you encountered problems related to gfortran, it might be because RcppArmadillo is not installed previously. Try Mac OSX stackoverflow solution or Linux stackover solution if you have trouble installing RcppArmadillo.
We welcome contributions from everyone. Please follow the instructions below to make contributions.
Fork the repo.
Create a new branch from
mainbranch.-
Make changes and commit them.
- Please follow the Google’s R style guide for naming variables and functions.
- If you are adding a new family of models with new cost functions with corresponding gradient and Hessian, please add them to
src/fastcpd_class_cost.ccwith proper example and tests invignettes/gallery.Rmdandtests/testthat/test-gallery.R. - Add the family name to
src/fastcpd_constants.h. - [Recommended] Add a new wrapper function in
R/fastcpd_wrappers.Rfor the new family of models and move the examples to the new wrapper function as roxygen examples. - Add the new wrapper function to the corresponding section in
_pkgdown.yml.
Push the changes to your fork.
Create a pull request.
Make sure the pull request does not create new warnings or errors in
devtools::check().
Trouble installing Python package.
Python headers are required to install the Python package. If you are using Ubuntu, you can install the headers with:
sudo apt install python3-devEncountered a bug or unintended behavior?
- File a ticket at GitHub Issues.
- Contact the authors specified in DESCRIPTION.

Acknowledgements
Special thanks to clODE.